The "EPIC" dataset
Exploring the metadata
So, the week started with me shifting my focus from movement analysis to developmental biology. Which made me stumble upon the EPIC dataset. The website contained a lot of videos capturing the process of embryogenesis in the C. elegans embryo. The best part was that each video was accompanied with time tagged metadata with columns like:
-
xandyco-ordinates of the cell -
Cell name (more on that below)
-
Time value of when the data point was captured.
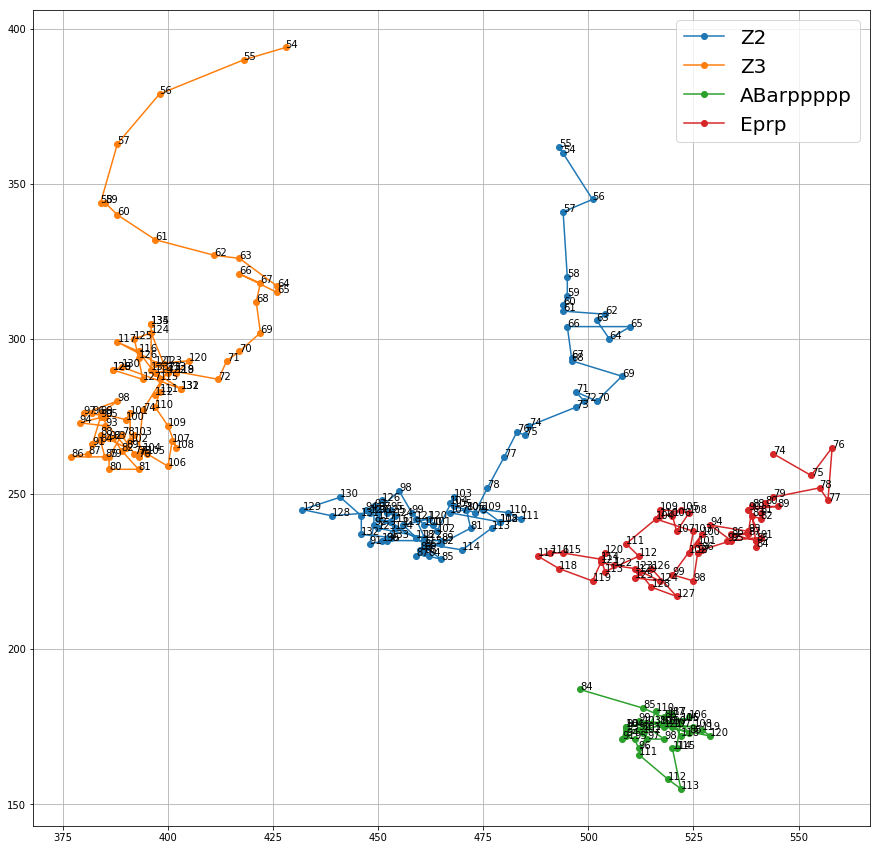
Plotting the movements of some of the cells gave an interesting insight on how a certain type of a dwells in a certain part of the embryo.
Deep learning on the metadata
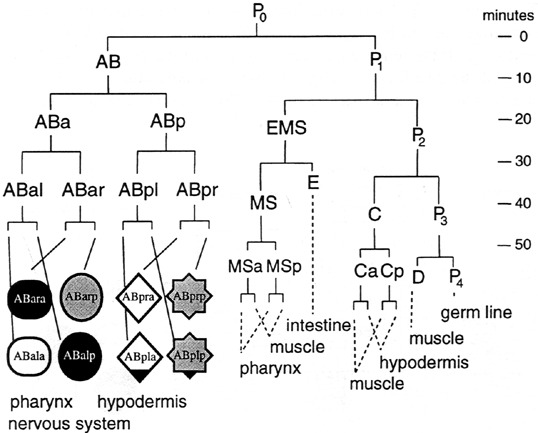
The first objective was to make sense of what the cell names meant, and the diagram shown below summed it up pretty well.
But there was a new problem now, it was that there were more than 700 unique cell names with a highly unbalanced distribution through the dataset.

The solution was to “shorten” the cell names to only the first few characters. This would give us info about the cell’s lineage (or the name of the cell itself, depending on the value of time) and not necessarily it’s precise name. This shortened compact_cellname would now be used as a label for the deep learning model.
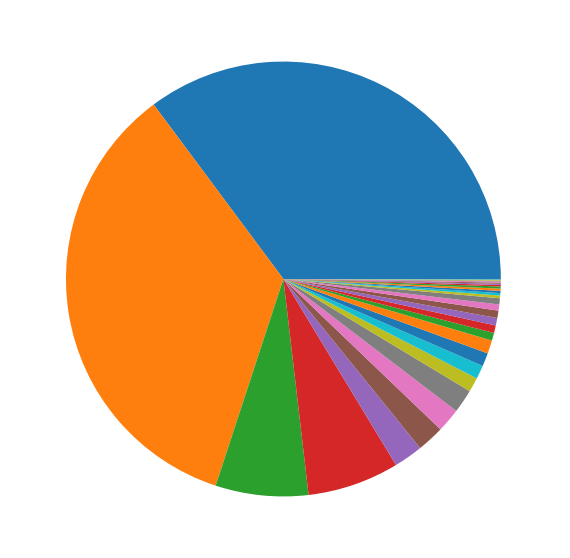
This reduced the number of labels to 32, but there was still a lot of imbalance (as seen above), which was taken care of by the RandomOverSampler().
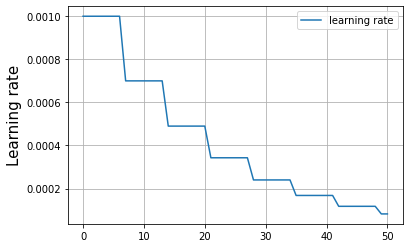
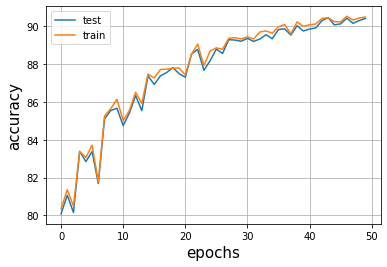
The next step was to train a model on the data, and with the help of an adaptive learning rate which only reduced when the loss plateaued (check - ReduceLROnPlateau()), the simple 5 layer model reached a a 90% accuracy after 30 epochs of training.
The model can obviously be improved in the coming weeks with more data and a better architecture.