Training the segmentation model
The objective of week 3 was to train the model initially on a dummy dataset(for prototyping) and then on a larger dataset. Check out this notebook if you want to have a better look.
The three primary conponents of our training pipeline were:
-
PyTorch for building, training and deploying the models.
-
albumentations for building the image augmentation pipeline. It was important for us to make sure that the image and the mask went through the same exact set of transforms whenever they’re loaded into the batch, and this was possible in this library.
-
segmentation-models-pytorch is a high level API to build models for multi class (or binary) image segmentation.
The issue with interpolation
The problem with the image loading class was that the pixel values were getting altered due to the resizing interpolations. This was fixed (or so I thought) with a manual override with mask[mask != 0] = 255. It converted all the non zero values to 255 forcefully, just like it was before going through the augmentative transforms.
Interestingly enough, I faced this problem even after using the manual fix. But this time it was because of the transforms.resize function within the torchvision.transforms. The problem was traced down to the interpolation, the very fact that the default interpolation was set to Image.BILINEAR (default arg) was the reason why the pixel values were getting altered in the mask. This was fixed by setting interpolation = Image.NEAREST.
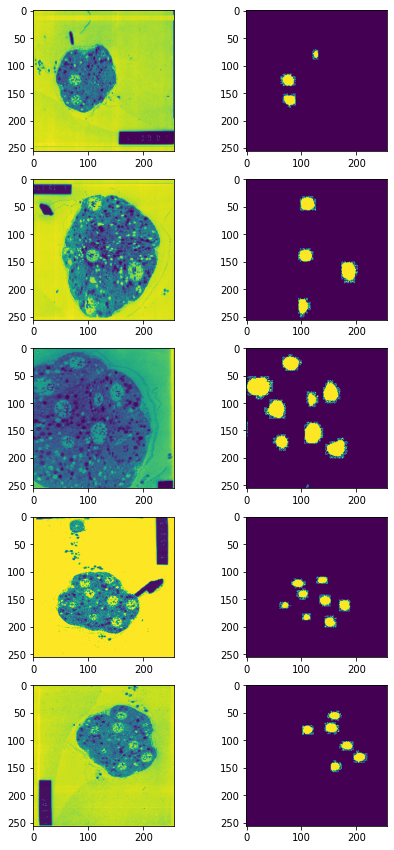
After all of these transforms, the training images and masks came out to be as shown:

The model
The next step was to train the model on the images, and for our case, we used the pre-trained ResNet18 as the encoder. Some of the other parameters used are as follows:
-
ACTIVATION = 'sigmoid'clamps the output pixel values between[0.,1.], which are ideal for calculating a loss with respect to a mask whose pixel values also are within the same range. -
DEVICE = 'cuda'moves the model to the GPU for training. -
in_channels = 1means the model takes grayscale images as input.
The loss function
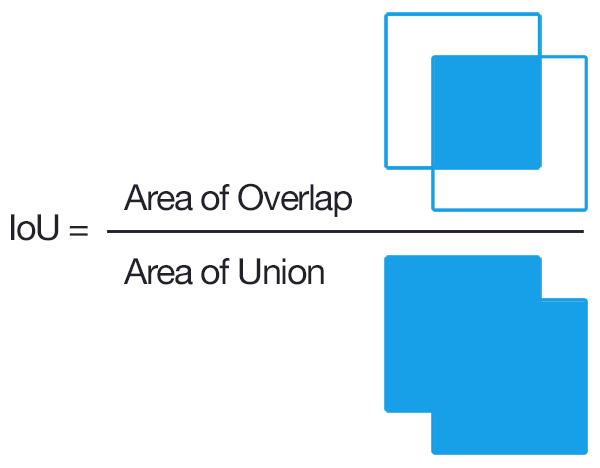
The Intersection Over Union score (also known as Jaccard Index) is a statistic used for gauging the similarity and diversity of sample sets. It is defined as:


Dice Coefficient can be seen as the percentage of overlap between the two sets, that is a number between 0 and 1. DiceLoss() can be mathematically defined as 1 - dice_coefficient:

Where |X| ∩ |Y| is the intersection where the prediction correctly overlaps the label in the 2D mask.
Training metrics and visualizing the outputs
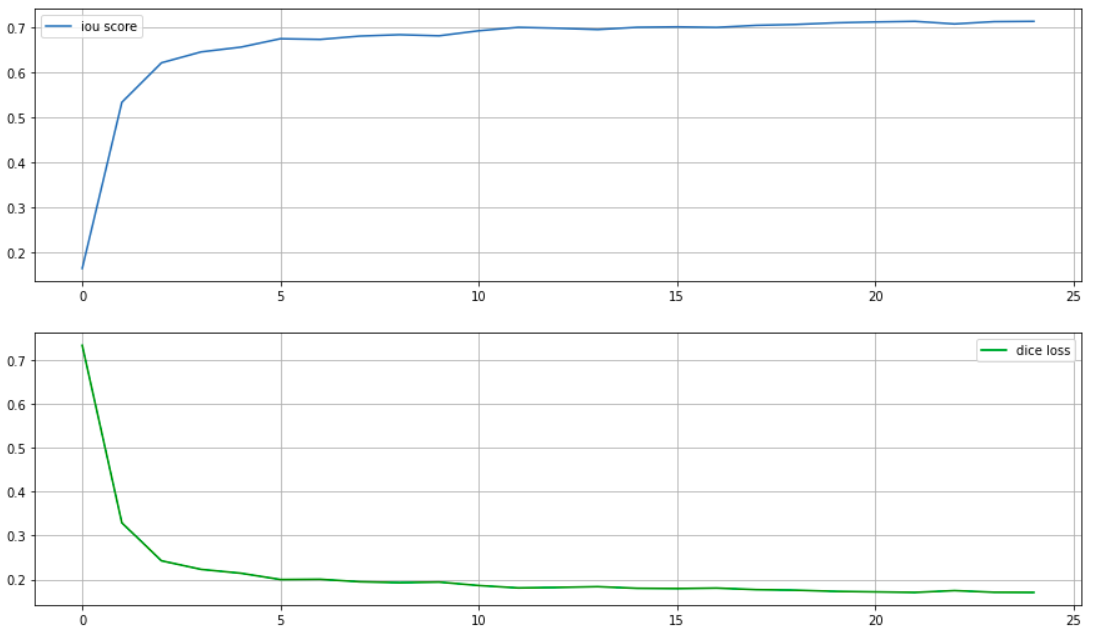
The model could hit an IOU score of just above 0.7 after 24 epochs of training.

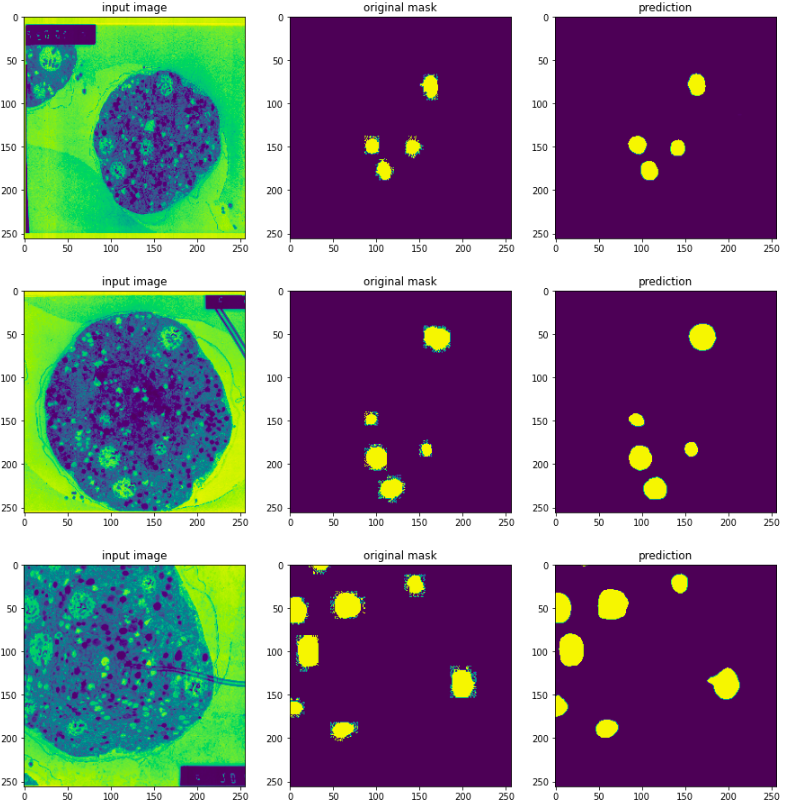
And when combined with some thresholding on the predicted images, here are the predicted results:
